Lo que es exclusivo de AirNav RadarBox: estadísticas de utilización de flotas y mapas de calor del aeropuerto
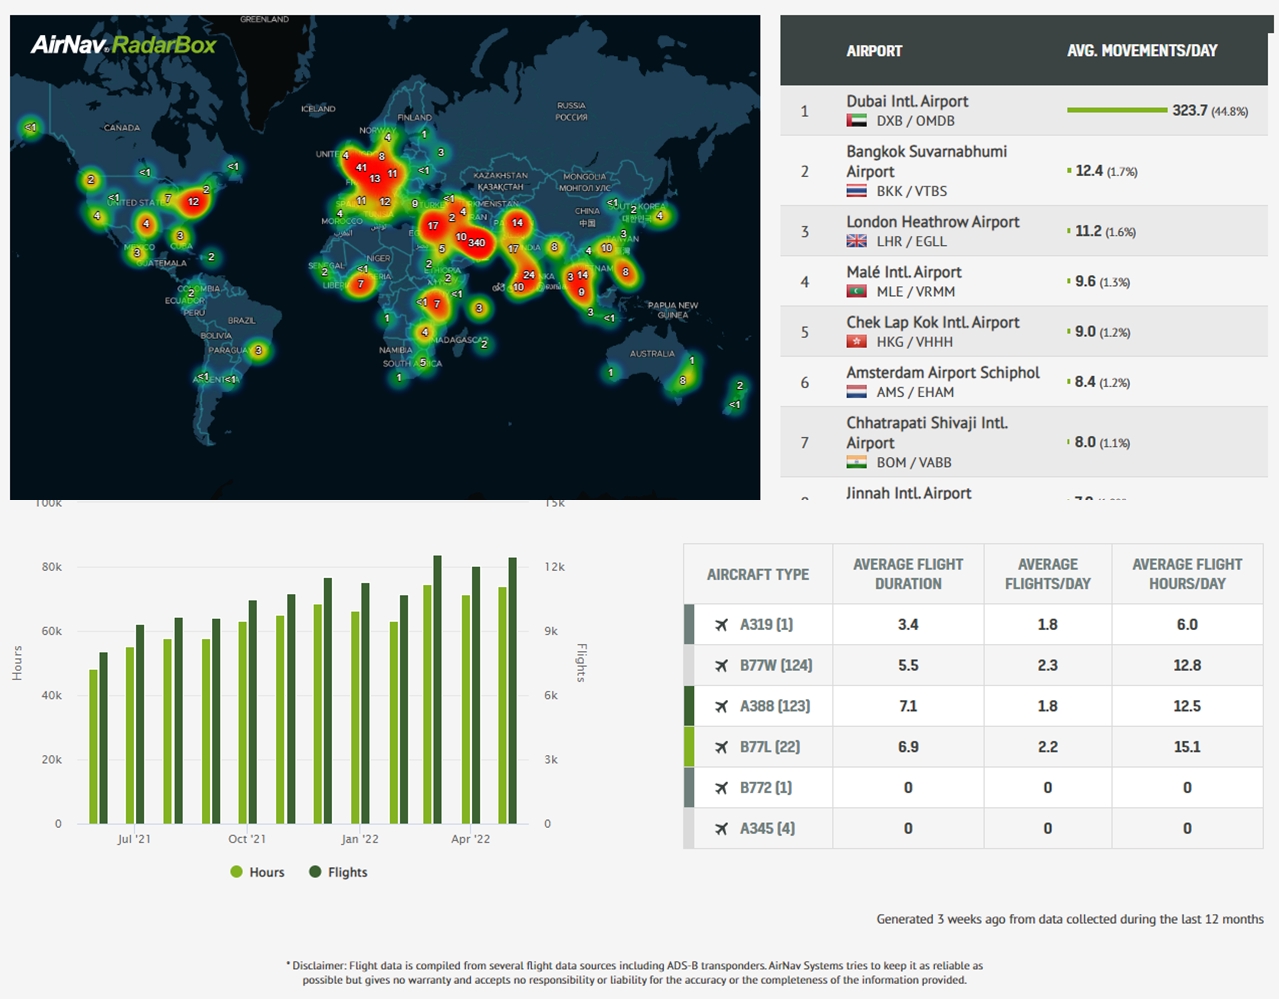
Estadísticas de utilización de la flota de Emirates y mapa de calor de ruta
El mapa de rutas térmicas del aeropuerto y las estadísticas de utilización de aeronaves y flotas son una característica exclusiva de AirNav. ¡Sigue leyendo nuestro blog para saber más!
Estadísticas de utilización de aeronaves
La utilización de la aeronave básicamente muestra la flota completa de una aerolínea en particular y presenta datos adicionales como:
- Duración media del vuelo.
- Promedio de vuelos por día.
- Promedio de horas de vuelo por día.
En el caso de Emirates, por ejemplo, los datos muestran una flota de 124 aviones Boeing 777-300ER que ofrecen una duración de vuelo promedio de 5,5 horas en dos vuelos por día, lo que da una calificación de horas de vuelo promedio total de 12,8.
Este tipo de información sería beneficiosa para las aerolíneas porque puede rastrear la frecuencia con la que vuelan sus aviones y si existe algún potencial en el futuro para aumentar dichos números en el futuro.
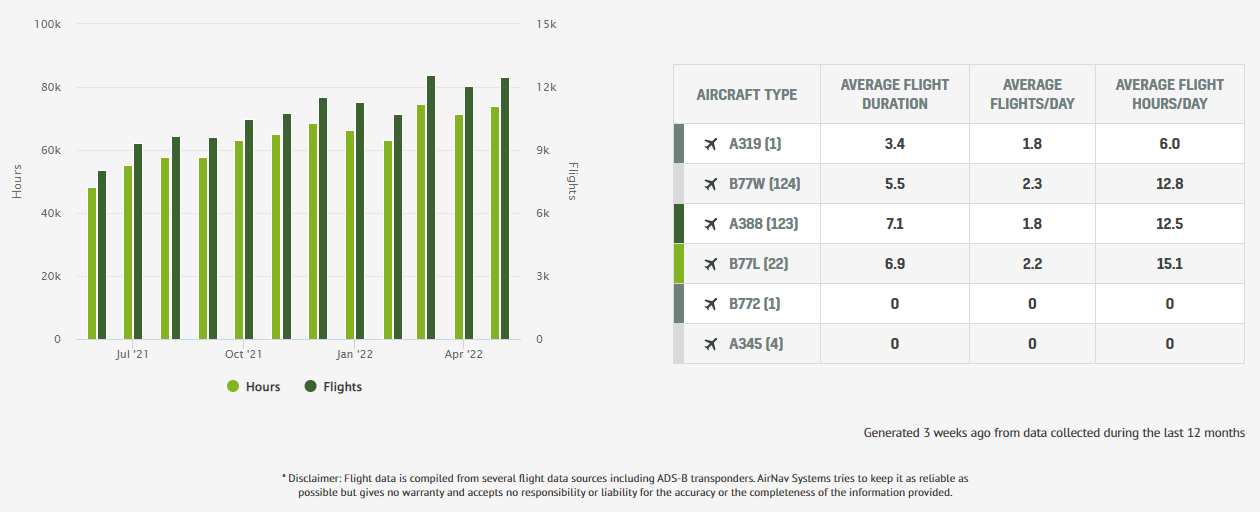
Estadísticas de utilización de la flota de Emirates
Airport Heat Maps convierte las estadísticas de rutas secas y monótonas en visualizaciones informativas, que muestran la frecuencia de vuelos a diferentes aeropuertos o ciudades desde un aeropuerto de origen en particular. Además de mapas de calor de rutas para aeropuertos, también proporcionamos mapas de calor de rutas para aviones y aerolíneas.
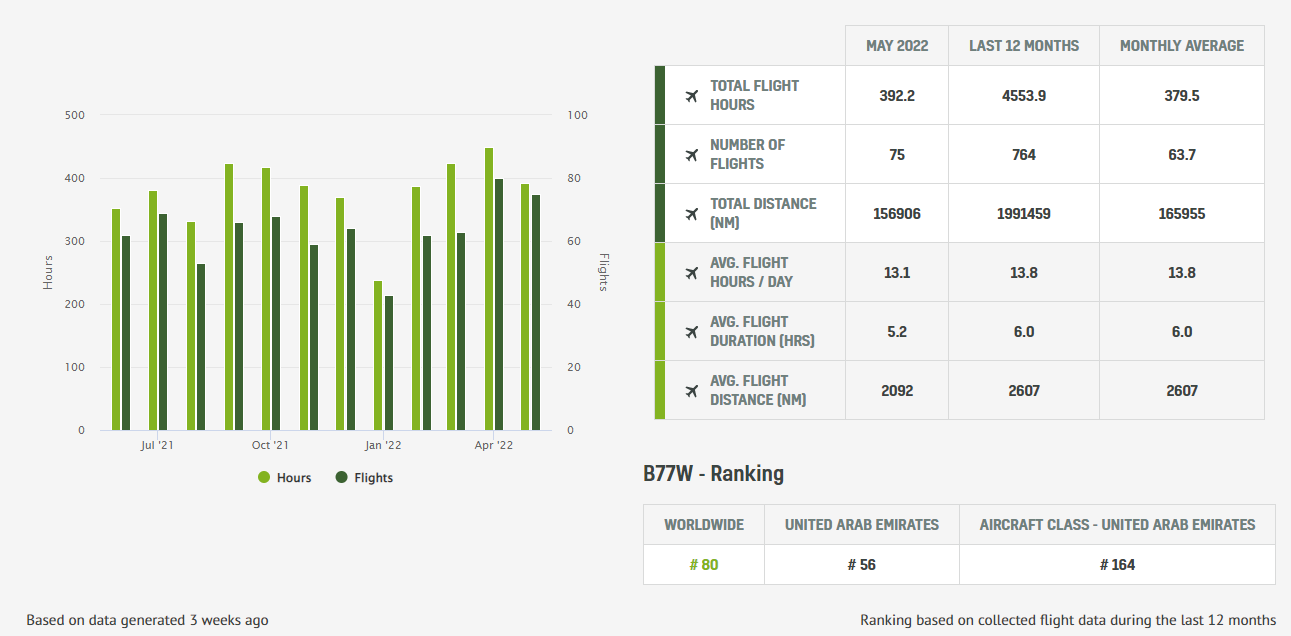
Estadísticas de utilización del Boeing 777-31HER (A6-EGC) de Emirates
Mapa de calor de la ruta del aeropuerto
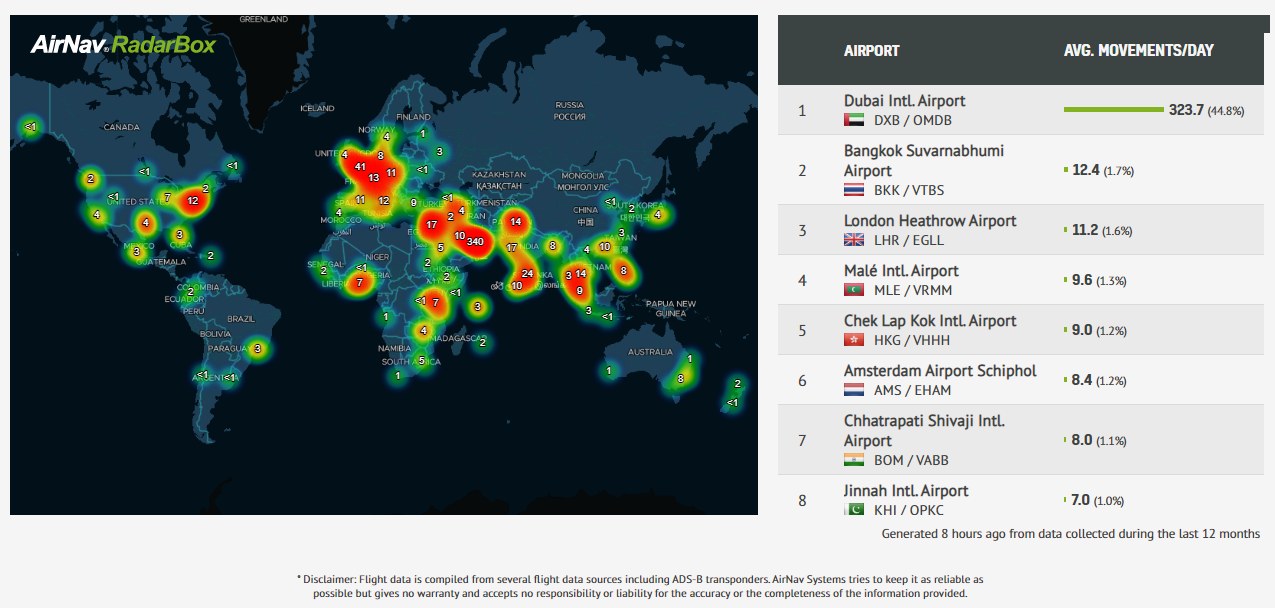
Mapa de calor de la ruta de los Emiratos proporcionado por AirNav RadarBox
Los aeropuertos de destino donde la frecuencia de vuelos es mayor se muestran en rojo o naranja. Por el contrario, los aeropuertos de destino donde la frecuencia de vuelos desde el aeropuerto de origen es menor se muestran en verde claro o amarillo.
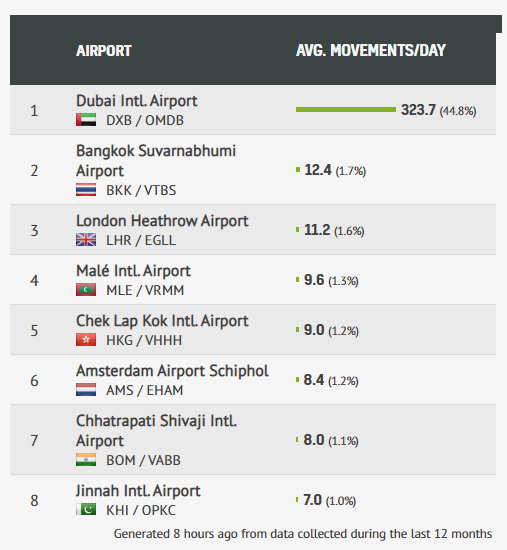
Destinos del mapa de calor de la ruta de los Emiratos proporcionados por AirNav RadarBox
Estos datos también determinan qué destinos son los más concurridos desde ese aeropuerto en particular. Arriba se ve un ejemplo de Ámsterdam Schiphol, donde Fráncfort del Meno, París CDG y el aeropuerto de Londres Heathrow son los destinos más concurridos desde ese aeropuerto de origen.