El aeropuerto de LaGuardia registra un crecimiento de tres dígitos
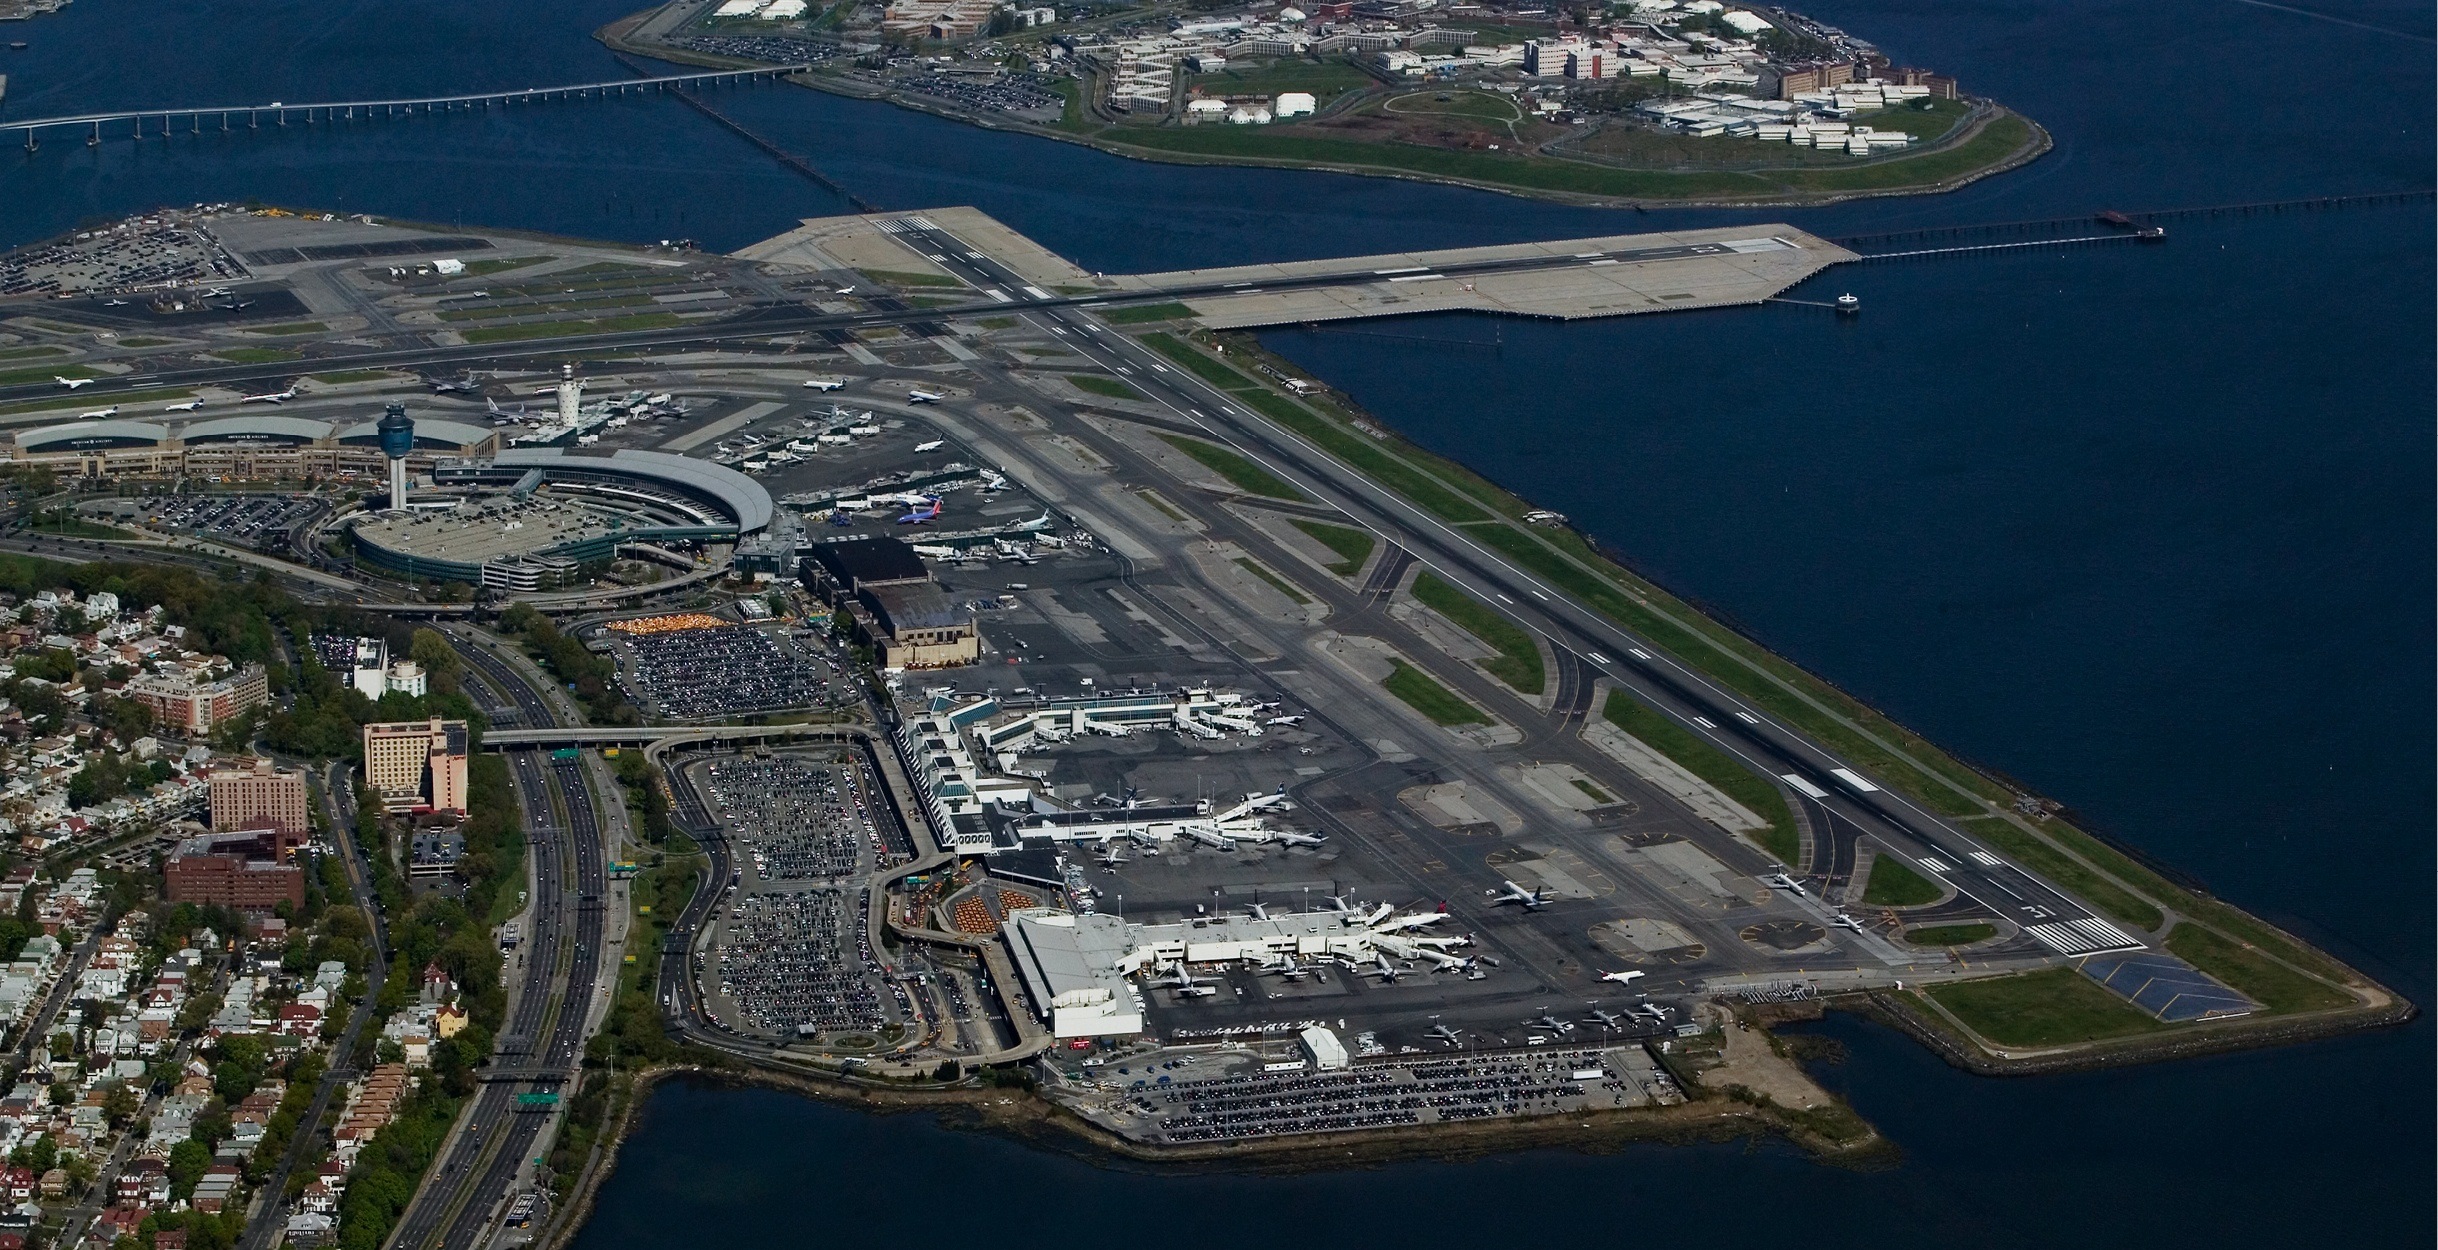
Nueva York - Aeropuerto LaGuardia desde arriba - Fuente de la imagen: Stvinc.com
Según los datos de AirNav RadarBox, el número de movimientos de vuelo en el aeropuerto LaGuardia de Nueva York ha aumentado en un + 150,63% en comparación con el mismo período en 2020. El aeropuerto JFK registró un menor crecimiento del + 106,19% durante el mismo período.
Nueva York - Estadísticas de vuelo del aeropuerto LaGuardia - Promedio de 7 días - (11-17 de septiembre):

Nueva York - John Kennedy Int. Estadísticas de vuelos del aeropuerto - Promedio de 7 días - (11-17 de septiembre):

Con la relajación de las medidas debido a la vacunación masiva en los EE. UU., Los aeropuertos de EE. UU. Han experimentado un crecimiento significativo debido a la alta demanda de viajes durante el verano.
Además, durante la pandemia de COVID-19, el aeropuerto de LaGuardia se sometió a importantes renovaciones con una inversión de aproximadamente $ 8 mil millones en la renovación de la Terminal B. La Terminal B se construyó en 1964 y apenas ha cambiado desde entonces. La remodelación de la terminal se considera la asociación público-privada más grande de la aviación de EE. UU.

Mapa del aeropuerto LaGuardia - Fuente de la imagen: Aeropuerto LaGuardia
Uno de los objetivos de la reconstrucción de la terminal fue hacer el aeropuerto cada vez más moderno y más accesible para quienes necesitan volar desde La Guardia, uno de los aeropuertos más importantes del país.

Parques de la explanada de la Terminal B del aeropuerto LaGuardia - Foto: Jeff Goldberg / Esto
El Aeropuerto LaGuardia (LGA) es uno de los principales aeropuertos de EE. UU. Según los Códigos Mundiales de Aeropuertos, en 2020, 8.245.192 personas fueron transportadas en el aeropuerto ubicado a 14 km del centro de la ciudad de Nueva York y en el puesto 28 entre los aeropuertos más transitados del país.
Entre el 11 y el 17 de septiembre se registraron 4.193 vuelos, con un promedio diario de 599 vuelos. Con relación a agosto, se registraron 7.787 vuelos en el aeropuerto. Desde el 21 de agosto, el aeropuerto ha registrado una tasa de crecimiento superior a los tres dígitos, superior al + 100% respecto al año pasado.
Entre los 10 destinos más populares para LaGuardia, cuatro de ellos se encuentran entre los 10 aeropuertos más concurridos de los EE. UU. (Atlanta - Aeropuerto Hartsfield-Jackson, Dallas / Fort Worth, Chicago O'Hare, Charlotte Douglas, etc.), según el mapa de calor de ruta proporcionado por AirNav RadarBox.
Nueva York - Mapa de ruta del aeropuerto LaGuardia en AirNav RadarBox:

Los 10 destinos más visitados son:
- Internacional de Chicago O'Hare Aeropuerto (ORD / KORD) 178,7 movimientos por semana
- Internacional Hartsfield Jackson de Atlanta Aeropuerto (ATL / KATL) 161,4 movimientos por semana
- Internacional de Dallas Fort Worth Aeropuerto (DFW / KDFW) 121,3 movimientos por semana
- Internacional Charlotte Douglas Aeropuerto (CLT / KCLT) 119,6 movimientos por semana
- Internacional de Fort Lauderdale Hollywood Aeropuerto (FLL / KFLL) 114,4 movimientos por semana
- Internacional de Miami Aeropuerto (MIA / KMIA) - 112,6 movimientos por semana
- Internacional de Orlando Aeropuerto Estados Unidos (MCO / KMCO) 108,6 movimientos por semana
- Aeropuerto Nacional Ronald Reagan de Washington (DCA / KDCA) 103,6 movimientos por semana
- Internacional de Nashville Aeropuerto Estados Unidos (BNA / KBNA) 84,2 movimientos por semana
- Internacional General Edward Lawrence Logan Aeropuerto (BOS / KBOS) 77,9 movimientos por semana
Estas cifras representan el 61% de las cifras prepandémicas. En comparación, este año registró 4.193 vuelos. En el mismo período del año pasado se registraron 1.841 vuelos, mientras que en 2019 se reportaron 7.364 vuelos.
- 2019: 7.364 vuelos
- 2020: 1.841 vuelos
- 2021: 4.193 vuelos
En general, los aeropuertos en los EE. UU. Han experimentado un crecimiento superior al 10% en la mayor parte de los EE. UU. Debido a la recuperación de los viajes de placer nacionales y la flexibilización de las medidas sanitarias debido a la vacunación, lo que aumenta la demanda de vuelos dentro del país.