Analysis: June 2024 Marks Persistent Growth in Global Commercial Air Traffic

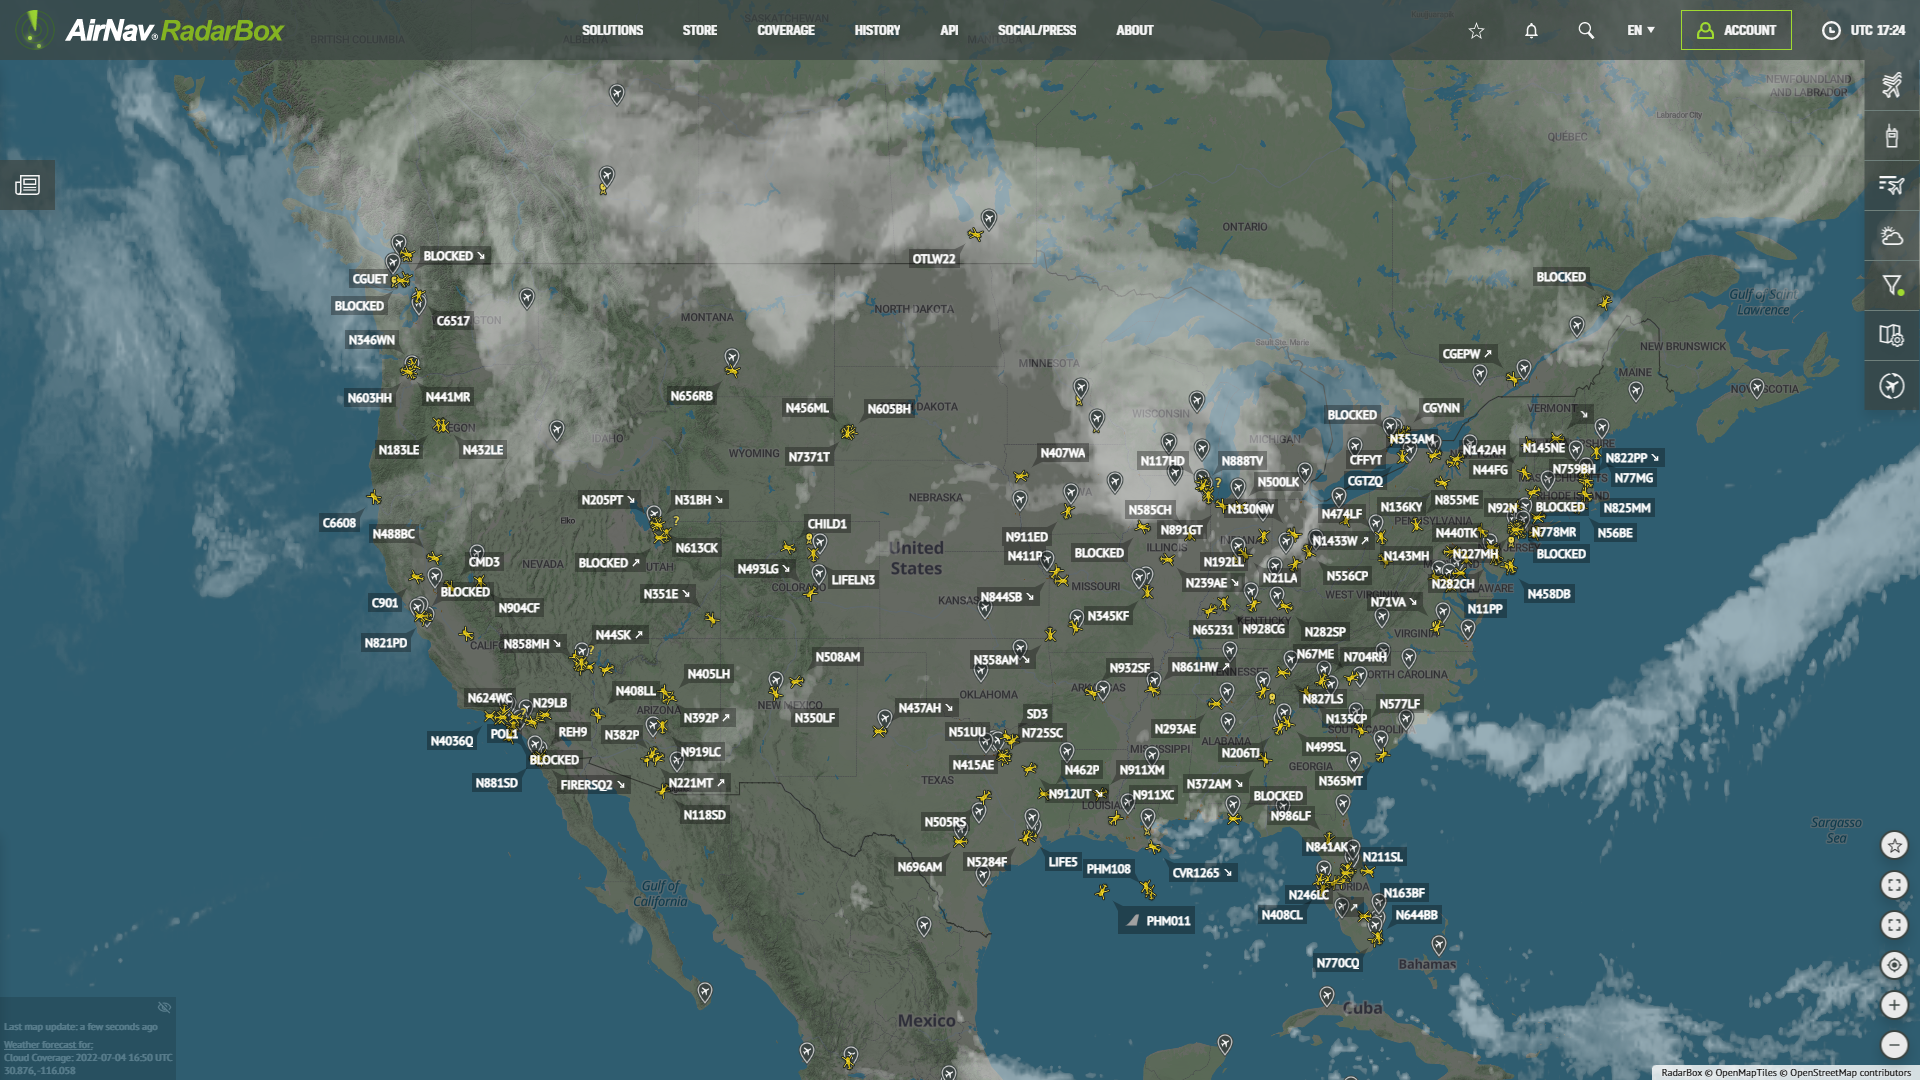
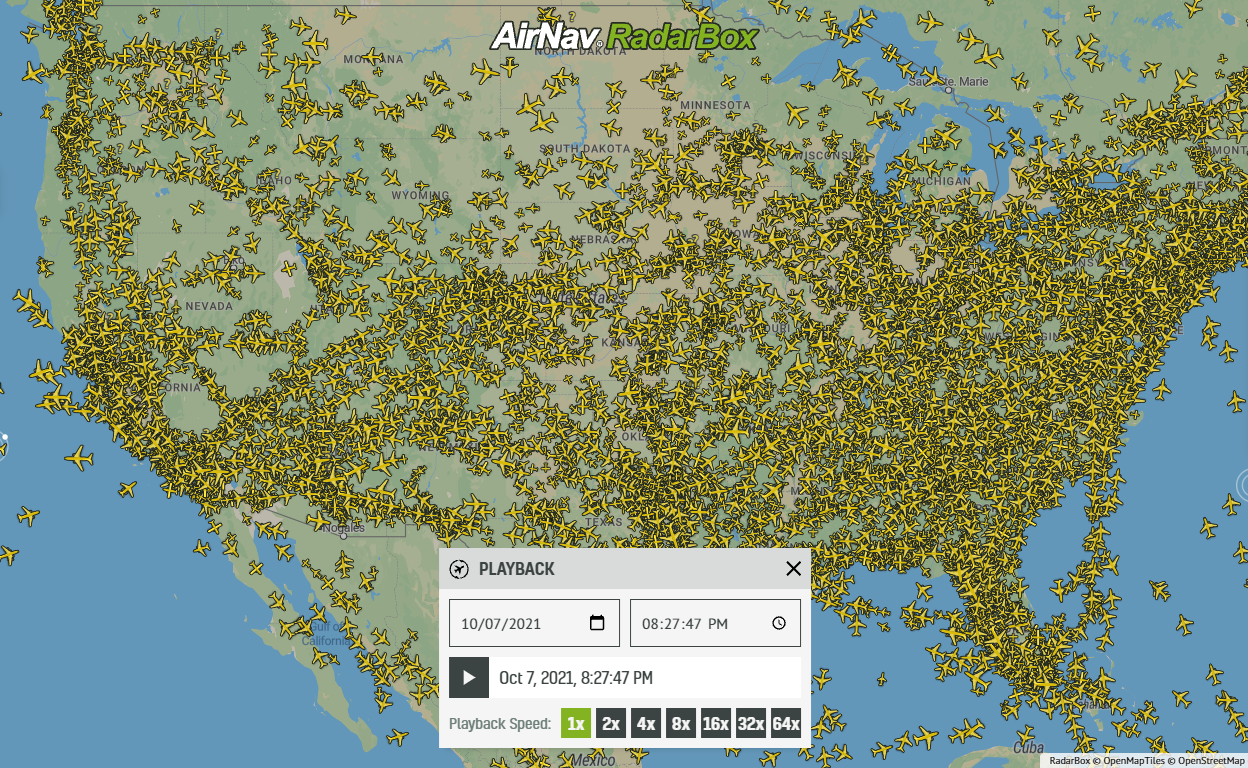
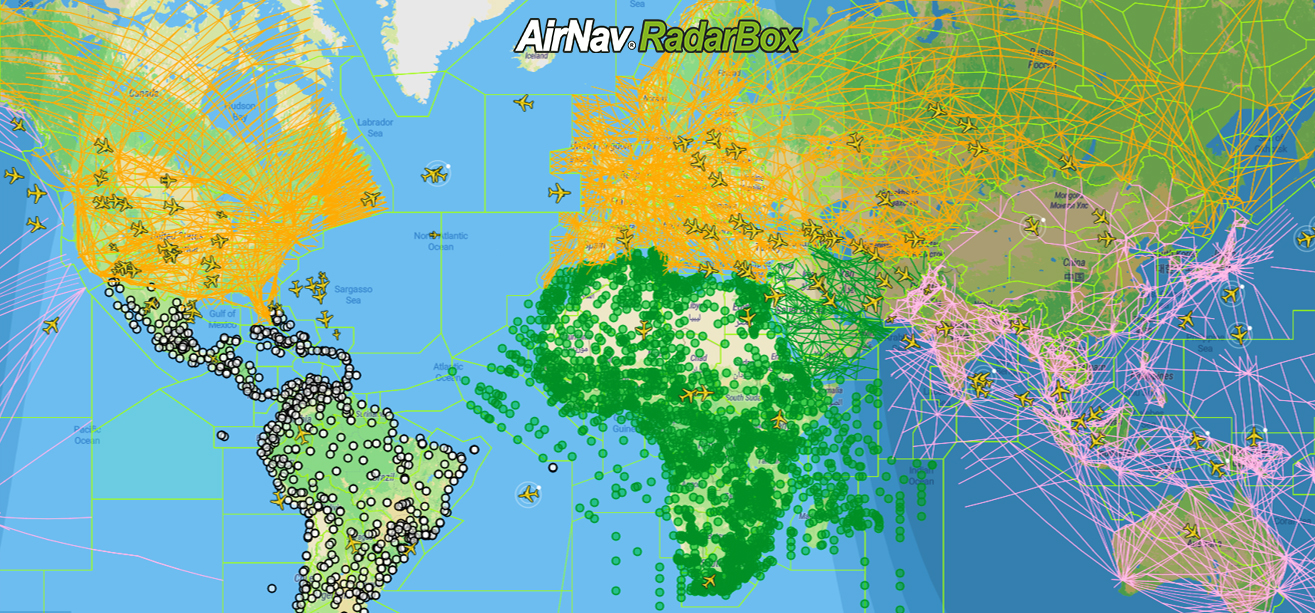
Global air traffic tracked via RadarBox.com
The global commercial aviation sector has experienced significant growth this week, with an 8.52% increase in flights compared to last year. From June 18 to June 26, 117,485 flights were recorded, compared to 108,265 flights in the same period in 2023. This notable rise highlights the aviation industry's recovery and expansion, driven by increasing travel demand and the lifting of various travel restrictions.

Global commercial aviation statistics
1. Busiest Airports in the World

Busiest Airports Globally provided by AirNav RadarBox
During this period, the world's busiest airports saw substantial traffic:
- Atlanta (ATL/KATL): With an average of 2,300 daily movements, Atlanta remains the leading global aviation hub.
- Chicago (ORD/KORD): Close behind, Chicago registered 2,279 average daily movements.
- Dallas-Fort Worth (DFW/KDFW): Following closely, Dallas-Fort Worth saw an average of 2,128 daily flights.
2. Leading Airlines by Daily Movements

Busiest Airlines provided by AirNav RadarBox
American Airlines dominated the skies with the highest average daily movements:
- American Airlines: Leading the pack with 6,127 average daily movements.
- Delta Air Lines: Following with 4,954 average daily movements.
- United Airlines: Close behind with 4,515 average daily movements.
3. Busiest City Pairs

Busiest City Pairs provided by AirNav RadarBox
The most active routes globally reflect a mix of domestic and international travel:
- Jeju City (CJU/RKPC) - Seoul (GMP/RKSS): This route topped the list with an impressive 234 average daily movements.
- Sydney (SYD/YSSY) - Melbourne (MEL/YMML): Registered 149 average daily movements.
- New Delhi (DEL/VIDP) - Mumbai (BOM/VABB): Recorded 116 average daily movements.
4. Most Active Aircraft Types

Most Active Aircraft Types & Aircraft Distribution provided by AirNav RadarBox
The following aircraft types dominated the skies:
- Boeing 737-800
- Airbus A320
- Cessna 172
5. Distribution of Flight Operations
The breakdown of flight operations during this period is as follows:
- Airliners: 50.7%
- General Aviation: 33.8%
- Helicopters: 6.5%
- Business Jets: 5.2%
- Military: 2%
- Cargo: 1.7%
6. Density Map
We've recently introduced an innovative feature that revolutionizes how you view aircraft movements: Density Maps. We can see aircraft positions over the last 7 days, perfectly overlaid on an intuitive map interface. Learn more about our density maps by clicking here.
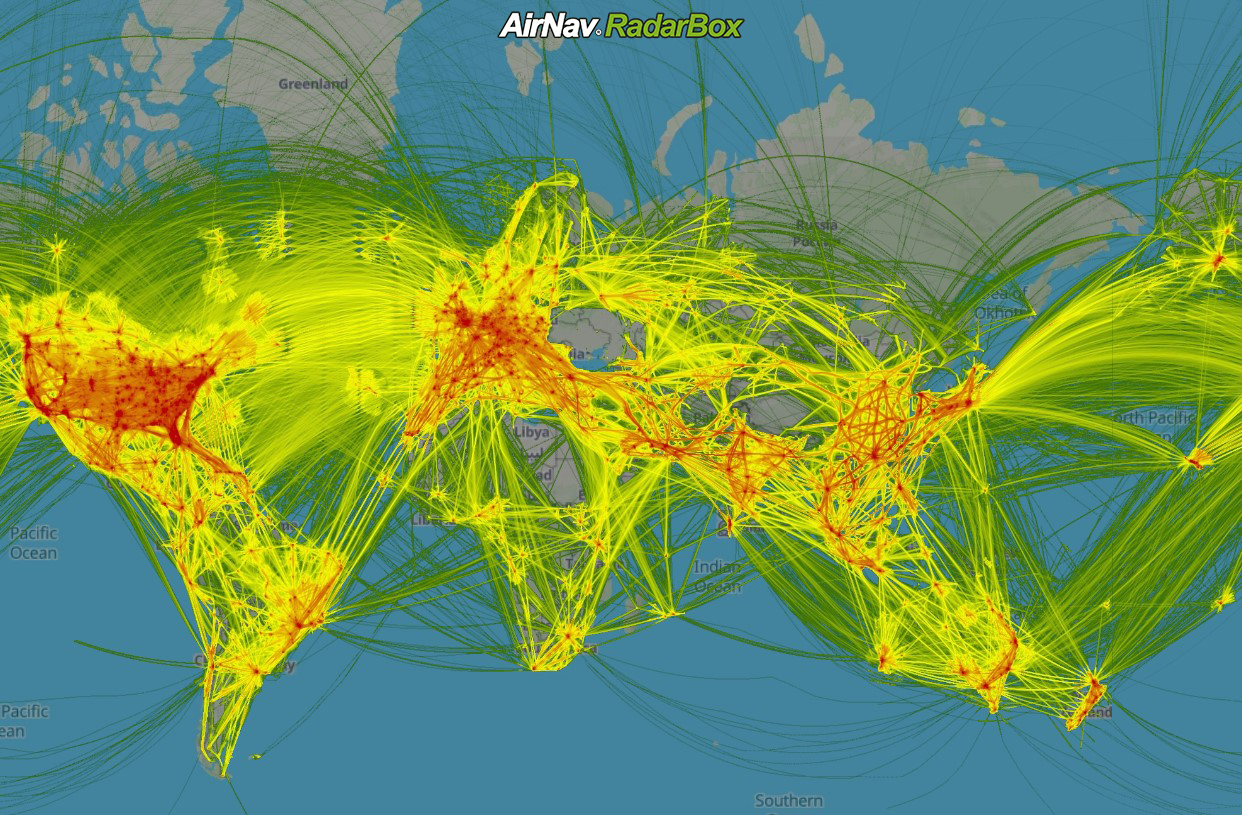
Density Maps provided by AirNav RadarBox
Conclusion
The 8.52% growth in global commercial aviation highlights a robust recovery and ongoing expansion within the industry. Leading airports and airlines are experiencing significant daily movements, and a diverse range of aircraft types contributes to the surge.